This performance index documents wicket-taking metrics for the Women’s Premier League from 2023 through 2026.
Data is compiled from official league records and organized for comparative analysis across four tournament editions.
The top 10 players with most wickets in WPL 2026 are ranked by total wickets taken during the specified period.
All statistical entries include match participation, best bowling performances, averages, economy rates, and strike rates measured according to standard cricket recording methods.
This index is designed for rapid reference and cross-player comparison.
No analytical interpretation or performance evaluation is provided beyond recorded numerical values.
Players With Most Wickets in WPL 2026
Top 10 Players With Most Wickets in WPL 2026
| Rank | Player | Franchise | Matches Played | Total Wickets | Best Figures | Average | Economy |
|---|---|---|---|---|---|---|---|
| 1 | Amelia Kerr | Mumbai Indians | 31 | 45 | 5/38 | 16.73 | 7.40 |
| 2 | Hayley Matthews | Mumbai Indians | 29 | 41 | 3/5 | 17.56 | 7.24 |
| 3 | Sophie Ecclestone | UP Warriorz | 27 | 38 | 4/13 | 18.78 | 6.80 |
| 4 | Nat Sciver-Brunt | Mumbai Indians | 31 | 35 | 3/18 | 22.54 | 7.89 |
| 5 | Jess Jonassen | Delhi Capitals | 24 | 33 | 4/31 | 20.75 | 7.74 |
| 6 | Shikha Pandey | UP Warriorz | 29 | 32 | 3/23 | 23.53 | 7.10 |
| 7 | Marizanne Kapp | Delhi Capitals | 26 | 28 | 5/15 | 21.42 | 5.94 |
| 8 | Deepti Sharma | UP Warriorz | 27 | 27 | 4/19 | 31.40 | 8.35 |
| 9 | Ashleigh Gardner | Gujarat Giants | 27 | 26 | 3/31 | 28.65 | 8.61 |
| 10 | Saika Ishaque | Mumbai Indians | 23 | 25 | 4/11 | 21.20 | 7.69 |
WPL Top 10 Wicket Takers: Complete Stats
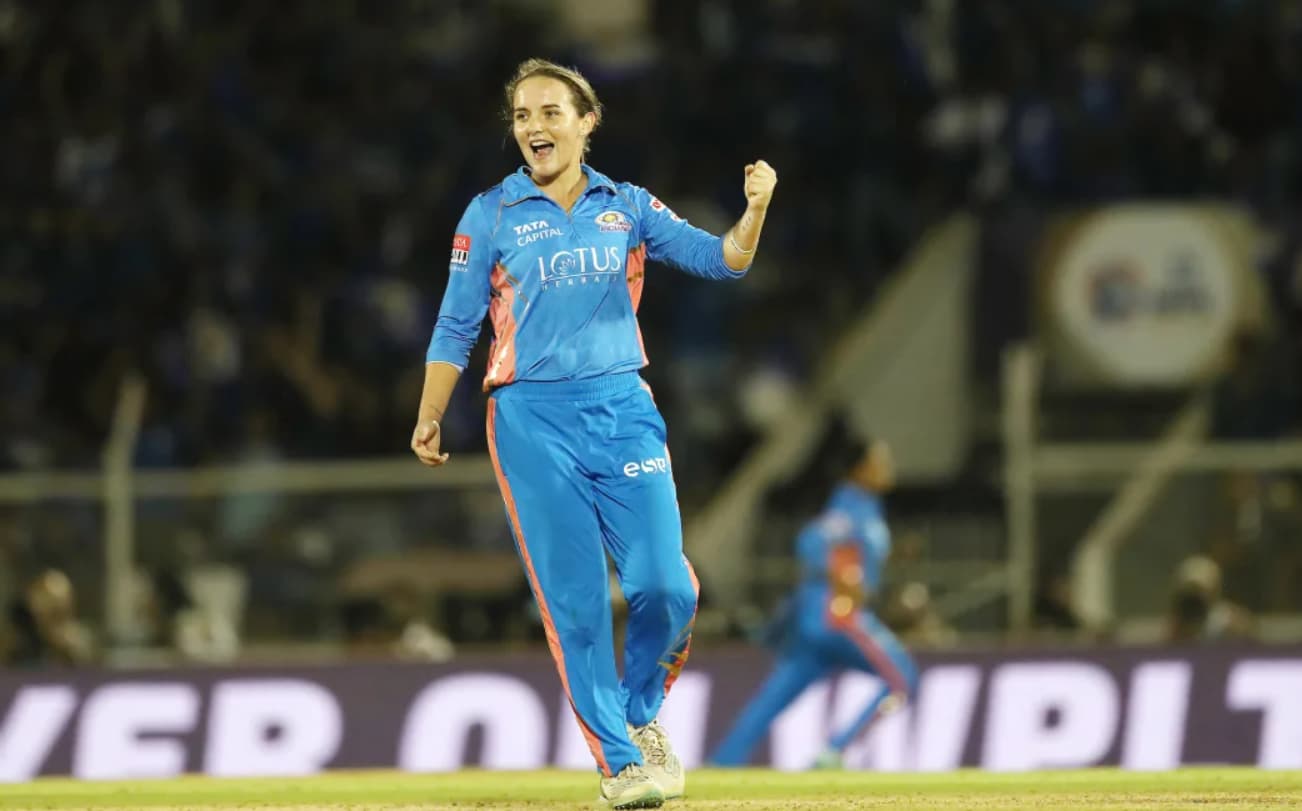
Amelia Kerr (45 Wickets)
Tournament Metrics
| Matches | Wickets | Best Figures | Average | Economy | Strike Rate |
|---|---|---|---|---|---|
| 31 | 45 | 5/38 | 16.73 | 7.40 | 13.55 |
- Leg-spin bowling classification
- Mumbai Indians across four consecutive seasons
- Appeared in 31 of Mumbai Indians’ total fixtures
- Lowest strike rate (13.55) among all players in index
Hayley Matthews (41 Wickets)
Tournament Metrics
| Matches | Wickets | Best Figures | Average | Economy | Strike Rate |
|---|---|---|---|---|---|
| 29 | 41 | 3/5 | 17.56 | 7.24 | 14.53 |
- Off-spin bowling classification
- Mumbai Indians franchise affiliation
- Accumulated wickets across 29 match appearances
- Second-lowest bowling average (17.56) in documented group
Sophie Ecclestone (38 Wickets)
Tournament Metrics
| Matches | Wickets | Best Figures | Average | Economy | Strike Rate |
|---|---|---|---|---|---|
| 27 | 38 | 4/13 | 18.78 | 6.80 | 16.57 |
- Left-arm orthodox spin classification
- UP Warriorz franchise member
- Participation across all four tournament editions
- Lowest economy rate (6.80) among indexed players
Nat Sciver-Brunt (35 Wickets)
Tournament Metrics
| Matches | Wickets | Best Figures | Average | Economy | Strike Rate |
|---|---|---|---|---|---|
| 31 | 35 | 3/18 | 22.54 | 7.89 | 17.14 |
- Medium-pace bowling classification
- Mumbai Indians franchise association
- Highest match count (31) among top 10 players
- Delivered 100.0 complete overs in tournament history
Jess Jonassen (33 Wickets)
Tournament Metrics
| Matches | Wickets | Best Figures | Average | Economy | Strike Rate |
|---|---|---|---|---|---|
| 24 | 33 | 4/31 | 20.75 | 7.74 | 16.09 |
- Left-arm orthodox spin classification
- Delhi Capitals franchise representation
- Participated in WPL 2023 and WPL 2025 only
- Lowest match count (24) among indexed players
Shikha Pandey (32 Wickets)
Tournament Metrics
| Matches | Wickets | Best Figures | Average | Economy | Strike Rate |
|---|---|---|---|---|---|
| 29 | 32 | 3/23 | 23.53 | 7.10 | 19.87 |
- Right-arm fast-medium classification
- Represented two franchises: Delhi Capitals (2023-2025), UP Warriorz (2026)
- Wickets distributed across 29 matches in four seasons
- Highest strike rate (19.87) among pace bowlers in index
Marizanne Kapp (28 Wickets)
Tournament Metrics
| Matches | Wickets | Best Figures | Average | Economy | Strike Rate |
|---|---|---|---|---|---|
| 26 | 28 | 5/15 | 21.42 | 5.94 | 21.64 |
- Right-arm fast-medium classification
- Delhi Capitals across all tournament editions
- Second-lowest economy rate (5.94) in documented group
- Best bowling figures of 5/15 recorded in 2023 season
Deepti Sharma (27 Wickets)
Tournament Metrics
| Matches | Wickets | Best Figures | Average | Economy | Strike Rate |
|---|---|---|---|---|---|
| 27 | 27 | 4/19 | 31.40 | 8.35 | 22.55 |
- Off-spin bowling classification
- UP Warriorz franchise member
- Exact 1:1 match-to-wicket ratio maintained
- Highest bowling average (31.40) among indexed players
Ashleigh Gardner (26 Wickets)
Tournament Metrics
| Matches | Wickets | Best Figures | Average | Economy | Strike Rate |
|---|---|---|---|---|---|
| 27 | 26 | 3/31 | 28.65 | 8.61 | 19.96 |
- Off-spin bowling classification
- Gujarat Giants with captaincy designation
- Consistency indicator: 27 matches across four seasons
- Highest economy rate (8.61) documented in index
Saika Ishaque (25 Wickets)
Tournament Metrics
| Matches | Wickets | Best Figures | Average | Economy | Strike Rate |
|---|---|---|---|---|---|
| 23 | 25 | 4/11 | 21.20 | 7.69 | 16.52 |
- Left-arm orthodox spin classification
- Mumbai Indians franchise association
- Wicket distribution: 15 (2023), 4 (2024), 6 (2025)
- Best bowling figures of 4/11 in the tournament record
Also Check:
- Top 10 Players With The Most Catches In IPL History
- Top 10 Double Centuries in ODI Cricket
- Top 10 Slowest Ball in Cricket History
- Top 10+ Best Wicket keeper in the World
- Most Centuries in Vijay Hazare Trophy
Final Verdict:
Index analysis of the players with most wickets in WPL reveals the following data distribution:
- Wicket-taking ability determines match outcomes and tournament standings
- Bowling type breakdown: 6 spin bowlers, 2 pace bowlers, 2 all-rounders with secondary bowling roles
- Franchise distribution: Mumbai Indians (4), UP Warriorz (3), Delhi Capitals (2), Gujarat Giants (1)
- National representation: India (3), England (2), Australia (2), New Zealand (1), West Indies (1), South Africa (1)
Performance consistency measured across multiple seasons shows sustained wicket-taking rates.
Strike rate range spans 13.55 to 22.55 deliveries per wicket. Economy rate variance documented between 5.94 and 8.61 runs per over.
Bowling average spread ranges from 16.73 to 31.40 across the indexed cohort.
Match participation levels vary from 23 to 31 fixtures per player.
Five-wicket haul achievements: 2 players. Four-wicket haul frequency: 5 players.
Total wickets by indexed players: 330 wickets. Average wickets per player: 33.0.
This index provides baseline data for comparative performance evaluation within the players with most wickets in WPL category.